Water quality monitoring and the resulting data may appear complex to lake property owners. The science is solid but includes many components that are either difficult for people to understand or that may appear to be inconsistent.
Perception of what lake property owners want from lake living is often different for different people. The Case For Water Quality Monitoring explores “what is a healthy lake”.
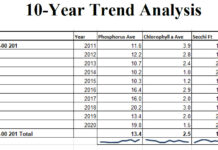
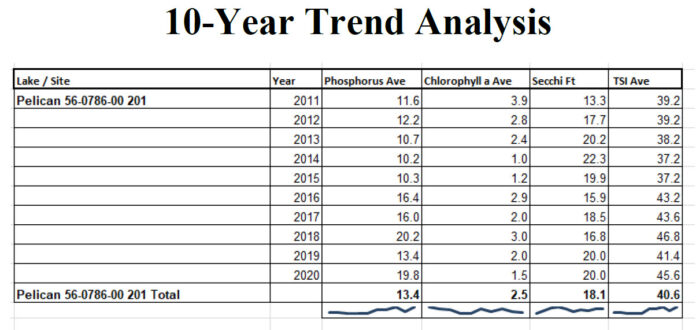
For several years OTC COLA has used data from samples collected by OTC COLA Member volunteers and analyzed by RMB Laboratories to create a 10-year Trend Analysis for each lake/site in the program. The data from individual samples for Phosphorus, Chlorophyll-a and Secchi disk are averaged for each year and further averaged for the 10-year Trend Analysis. All of the data comes directly from results published by RMB Labs and each component of COLA’s summary analysis is trackable and traceable back to the original dataset. To assist in understanding where a trend may be present there is a graph line that illustrates trends or anomalies for the 10 years.
The reason for COLA’s summary of the data is to give average persons the opportunity to obtain and understand water quality trends for their lakes; as well as the opportunity to find additional education and detail if they desire to do so.
OTC COLA’s Water Quality Analysis Reports includes tables for representation of the data results, links to pursue more information and educational and links to organizations and agencies.
In 2020 the OTC COLA Water Quality Analysis Program included 50 COLA Members, 55 lakes and 67 sampling sites.
Links to the Library of OTC COLA’s Water Quality Analysis Reports are routinely included in the OTC COLA E-Newsletter published each month. Historically they are, by far, the most popular links in each newsletter. Lake Associations have used them for presentations at annual meetings to not only acknowledge that the data being collected is being compiled and used but also to show trends of water quality.

